
Cross-filtering & inspection
A selection anywhere in the Data explorer updates everywhere. Here's how the four panels stay in sync.
Everything is linked
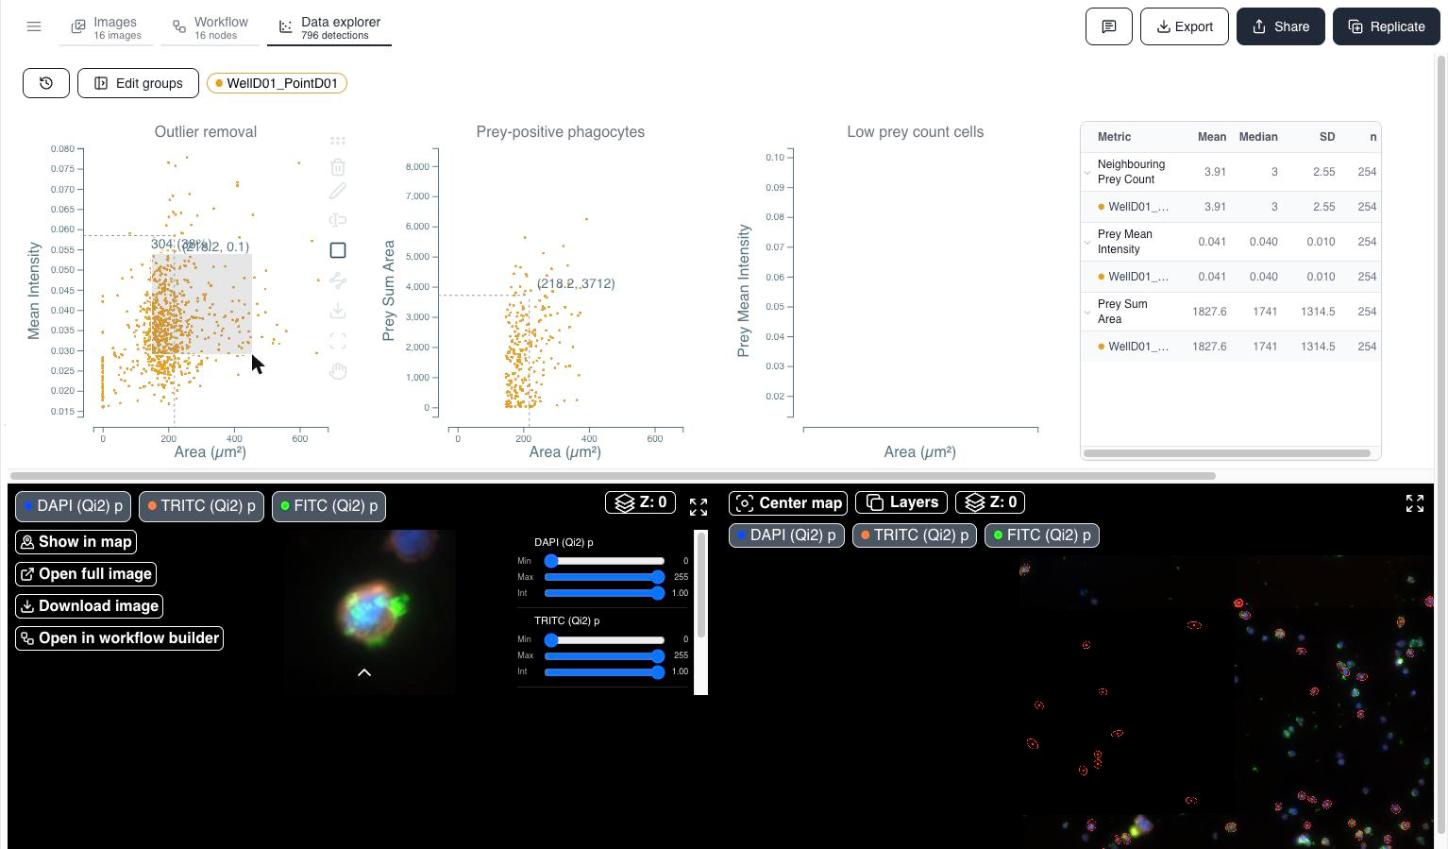
Scatter plots, histograms, statistics tables, cropped images, and the overview map are all backed by the same per-object dataset. Draw a gate on any plot and every other panel instantly filters to match - the table recalculates, the gallery shows only matching objects, and the map highlights their positions (Figure 1).
Cropped images
The lower-left panel shows a thumbnail per object in the current gated population, so you can visually confirm what a selection actually contains (Figure 1, lower left).
Overview map
The lower-right panel shows the full uploaded fields with detected objects outlined in purple (Figure 1, lower right). Center map recenters on the currently selected object.
Inspecting a single object
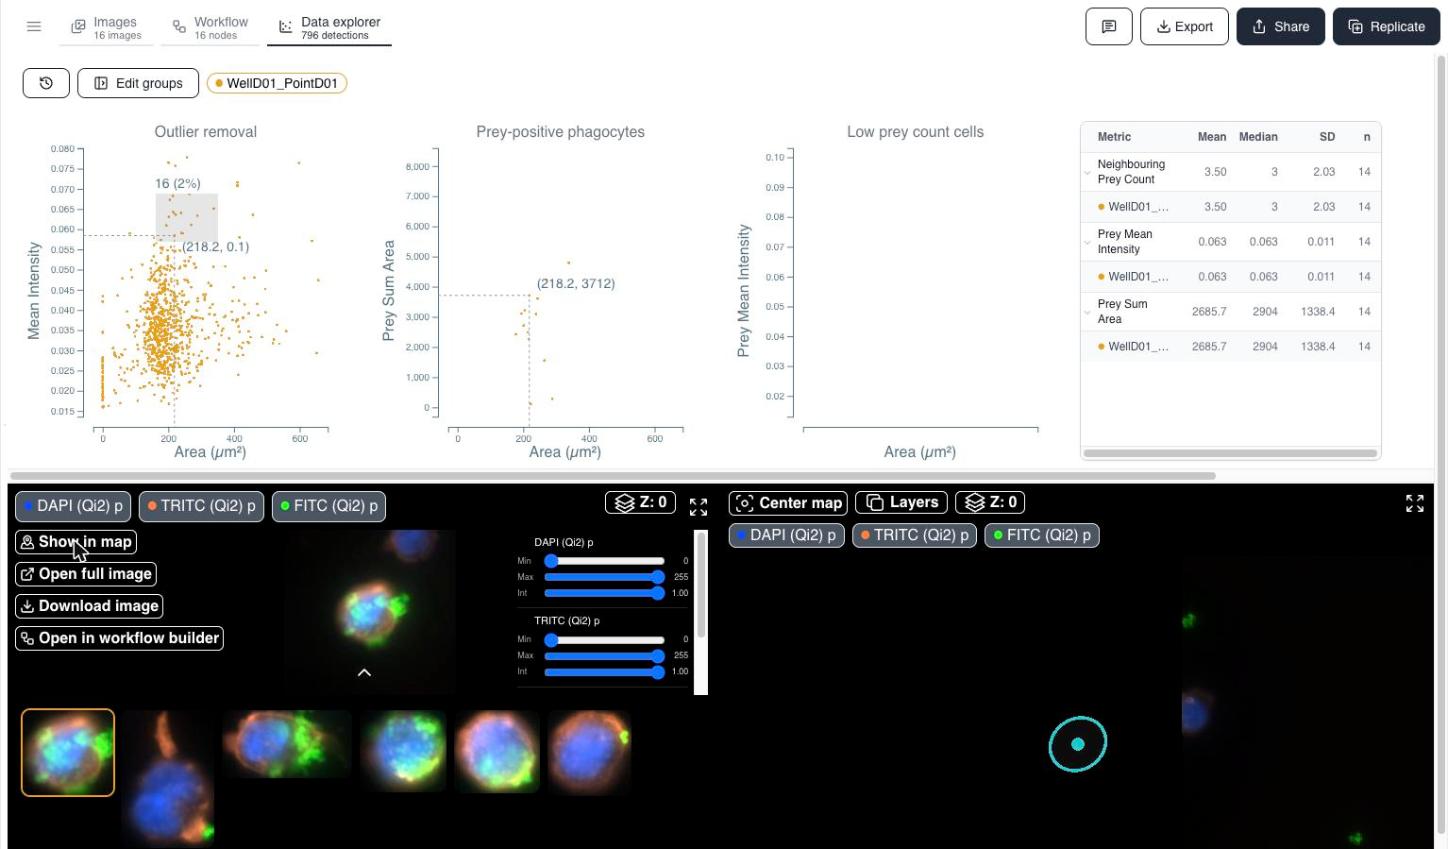
Click any thumbnail in the cropped images panel to open it. Cytely exposes (Figure 2):
- Per-channel intensity sliders - Min, Max, and Int for each channel, so you can adjust brightness/contrast for that single view.
- Show in map - centers the overview map on that object, marked with a cyan circle.
- Open full image - opens the parent field of view at full resolution.
- Download image - saves the cropped image locally.
- Open in workflow builder - jumps to the Workflow tab with that object's parent image as the preview source, so you can inspect exactly which pipeline steps produced it.