
Build a workflow using workflow builder
For full control, assemble the pipeline yourself in the visual builder and tune each node against its live preview.
Pick a source image
Open the Workflow tab and choose a representative image as the preview source. Every node's live preview renders against that image, so it should reflect the kind of data you're analyzing.
Add source channels
Add a source node per channel you want to analyze (for example DAPI for nuclei, TRITC for a marker). The colored channel pills on each source node control which acquisition channel it emits into the pipeline.
Add analysis steps
Click + Add step on any node's output to append the next step. Cytely offers a searchable library of algorithms grouped by category - segmentation, filtering, morphology, measurement, and aggregation.
A typical branch looks like: Source channel → Segmentation → Clean-up (Closing, Fill Holes) → Filter on Size → Morphology. Branches for different channels usually converge on a final aggregation node that links them together (for example Associate Prey and phagocyte).
Node detail panel
Clicking any node opens a detail panel with a plain-language description of what the step does, its expected inputs (with examples of the kinds of upstream nodes it accepts), and any tunable parameters - usually a mix of sliders and numeric fields.
The preview panel
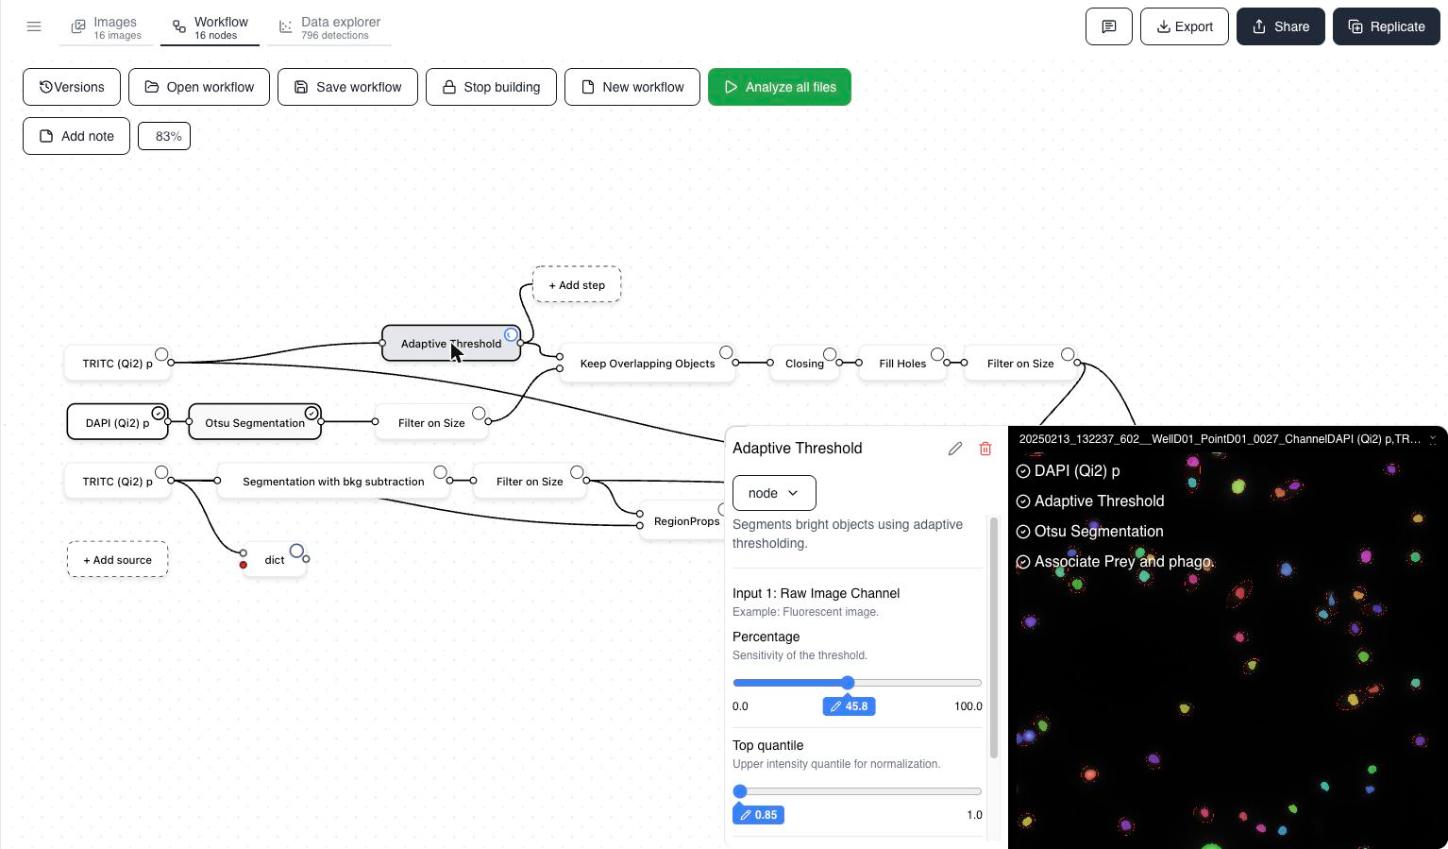
The preview on the right renders the node's output overlaid on the chosen source image. Above the image is a breadcrumb of every upstream step currently included in the preview, so you can see exactly which chain of operations produced the visible result. Adjust a parameter and the preview updates as soon as the pipeline re-runs.
Layers
The preview is built from layers: every node that is currently selected adds one.
How each kind of output is drawn:
- Source channels show the image they contain (nuclei stain, membrane stain, and so on) as an intensity image.
- A single intensity image - a source channel or a processed intensity image on its own - is displayed in grayscale.
- More than one intensity image at the same time is displayed in the color assigned to each source channel, so the layers can be told apart.
- Binary and labeled images are drawn in random colors. For labeled images each label gets its own color.
- Output nodes draw oval shapes where objects were detected. These ovals are not the actual segmentation mask - they are a marker showing where objects were found.
Preview-visibility toggle
Every node has a small circle in its top-right corner. This is a preview toggle, not a pipeline switch. Unchecking it removes that step from the breadcrumb and drops its layer from the preview - but the node itself and all its connections remain active in the pipeline. It only changes what you're currently inspecting, not what the workflow computes.
Switching preview channels
The preview panel exposes channel pills matching your source image, so you can flip between channels to sanity-check overlays against different underlying data.
The bin icon in the preview panel deletes the node you are currently inspecting.
Canvas shortcuts
- Select multiple nodes - hold
Shiftand drag on the canvas to rubber-band select every node inside the box. - Delete a selection - press
Backspaceto remove the selected node, or all currently selected nodes at once. - Delete a single node - open the node and click the bin icon in the preview window.
Run the workflow
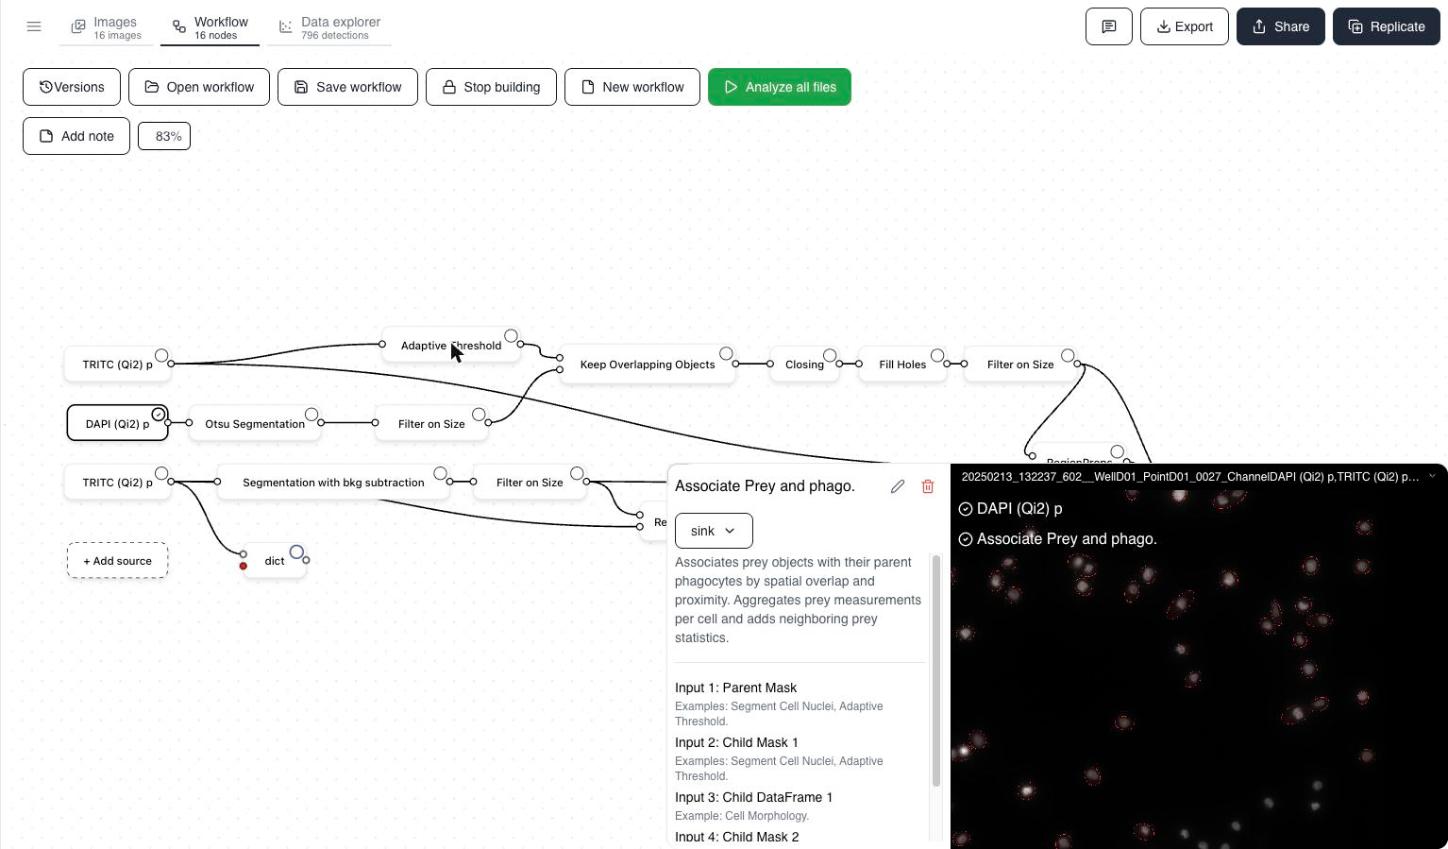
When you're happy, click Analyze all files to run the pipeline across the whole dataset. Save the workflow with Save workflow so you can reapply it to future datasets, and use Versions to review or roll back changes.