
Uploading & reviewing images
The Images tab is where every dataset starts. Drop your files in, organize them, and inspect what Cytely detected.
Uploading files
Drag and drop files anywhere on the Images tab, or click Upload files to browse. Cytely supports raw microscopy formats with intact metadata - .nd2, .czi, and TIFF.
For live acquisition, connect your microscope with Cytely Bridge to stream fields straight into the workspace.
Uploads run in the background - track them in the progress panel at the bottom of the page. Cytely creates a new dataset as soon as the first file lands and begins reading channel and metadata information.
Gallery, table, and map views
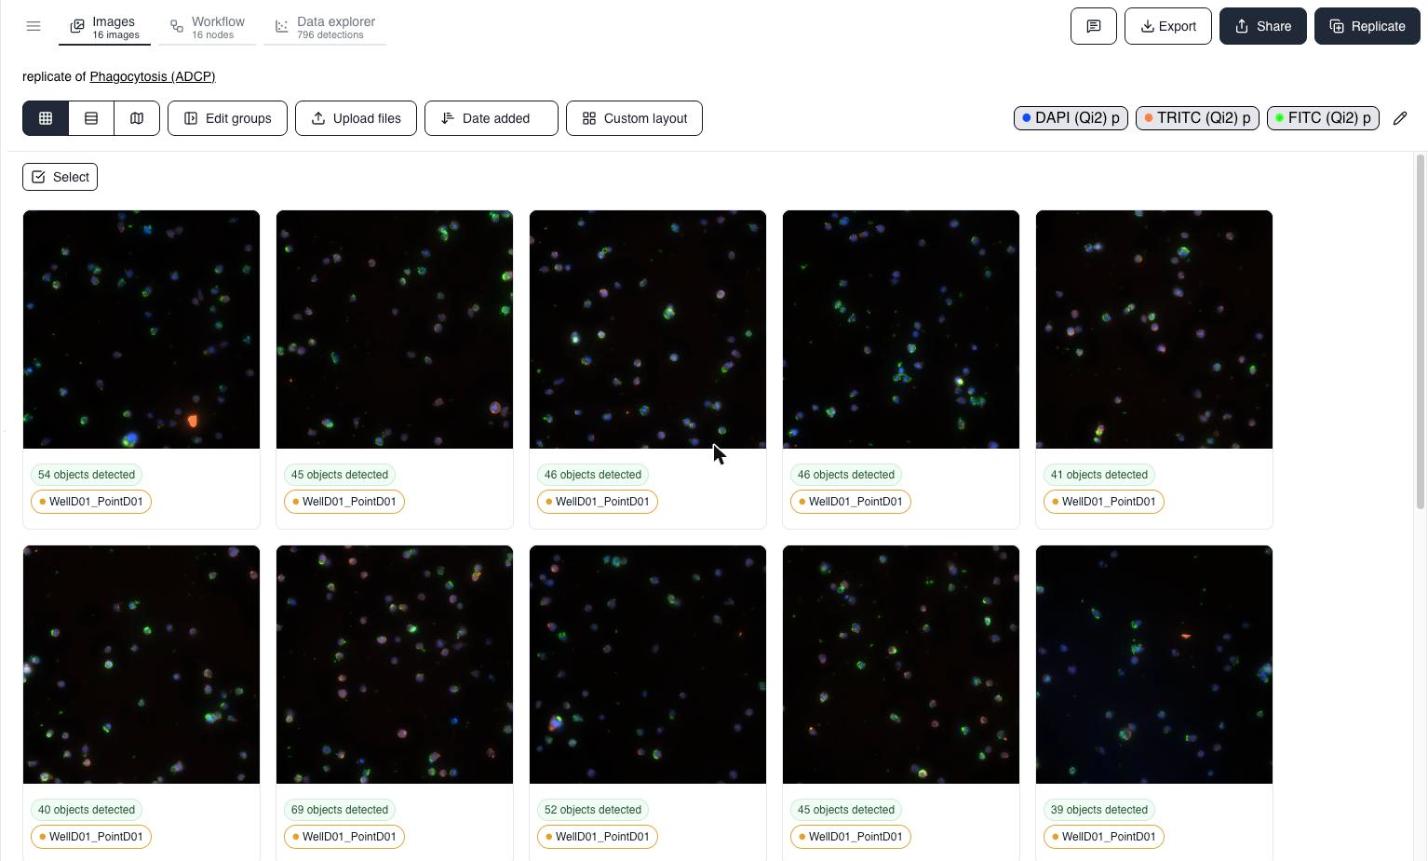
Switch between Gallery, Table, and Map layouts from the toolbar. Reorder with Date added (or by name, group, or detection count). Each card shows the file name, its group tag, and - once analyzed - how many objects were detected in that field.
- Gallery - thumbnail grid. Custom layout changes the arrangement, from 1x16 through 6x3, so you can trade thumbnail size for how much of the dataset fits on screen.
- Table - one row per file with the filename, acquisition timestamp, and per-row download and delete actions.
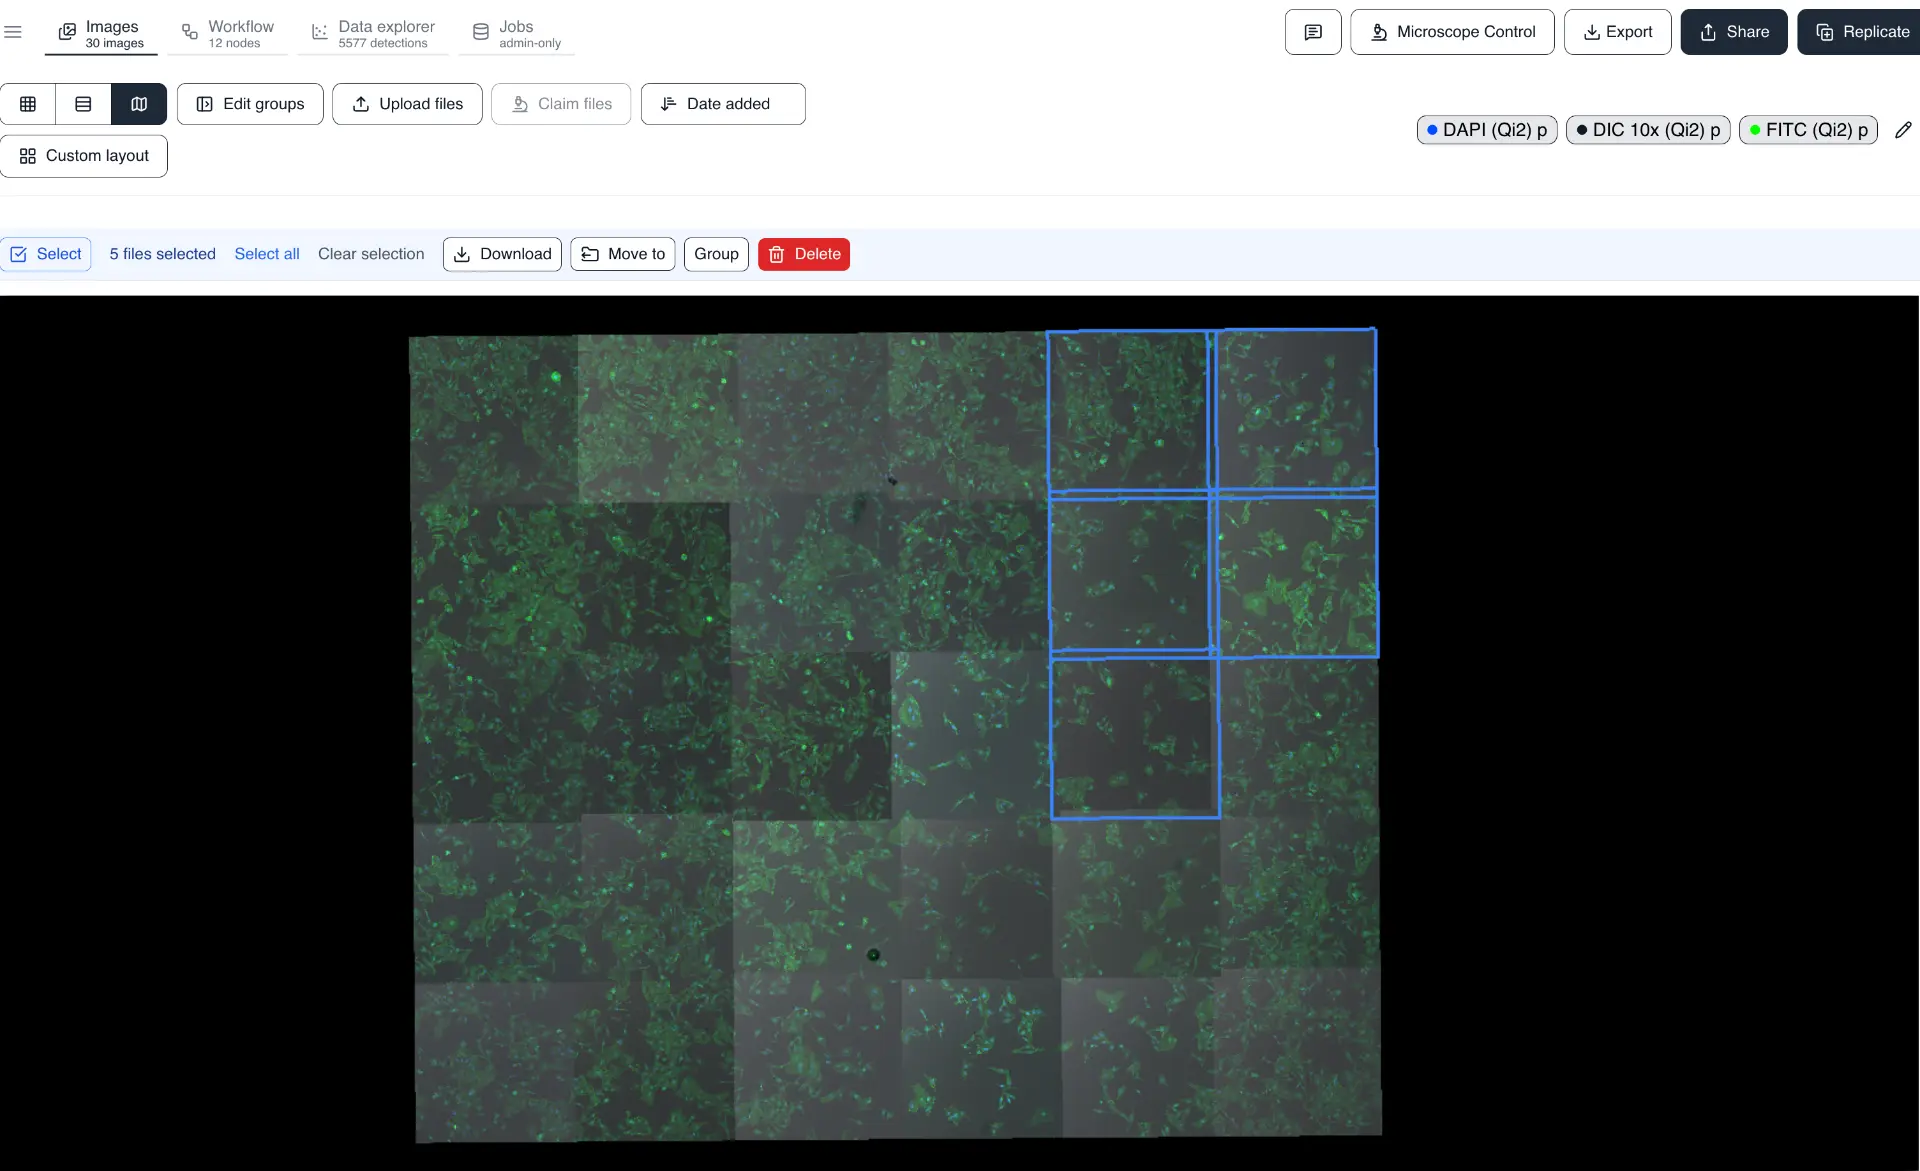
- Map - a zoomable plot of stage positions, showing where each field sits on the slide or plate.
Select turns on checkboxes for bulk actions: download, move to another experiment, or delete every checked image at once.
In Map view, Select also enables spatial selection: hold Shift and drag with the left mouse button to rubber-band select every field inside the box. Hold Cmd (Ctrl on Windows) and drag to add another box to the existing selection, or hold Cmd and click individual fields to add them one at a time.
Channels
The colored channel pills above the grid toggle each fluorescence channel on or off in the thumbnails (for example DAPI, TRITC, FITC). Use the pencil icon to rename channels or change the pseudo-color each channel is assigned in the composite thumbnails.
Grouping images
Click Edit groups to organize files into named replicates or conditions (e.g. WellD01_PointD01). Groups follow your data through analysis and appear as coloring in the Data explorer.
Add groups by hand with Add group, or let Auto group infer them from filenames and acquisition metadata (typically one group per well). Data explorer widgets and statistics are computed per group. Groups can be created or changed after the analysis has run - the Data explorer updates to reflect them.
Groups can also be created spatially in Map view: open the map, click Select, select the images you want, then click Group and give the group a name.
In the grouping view, a file can be moved into another existing group by dragging it onto that group.
Inspecting a single image
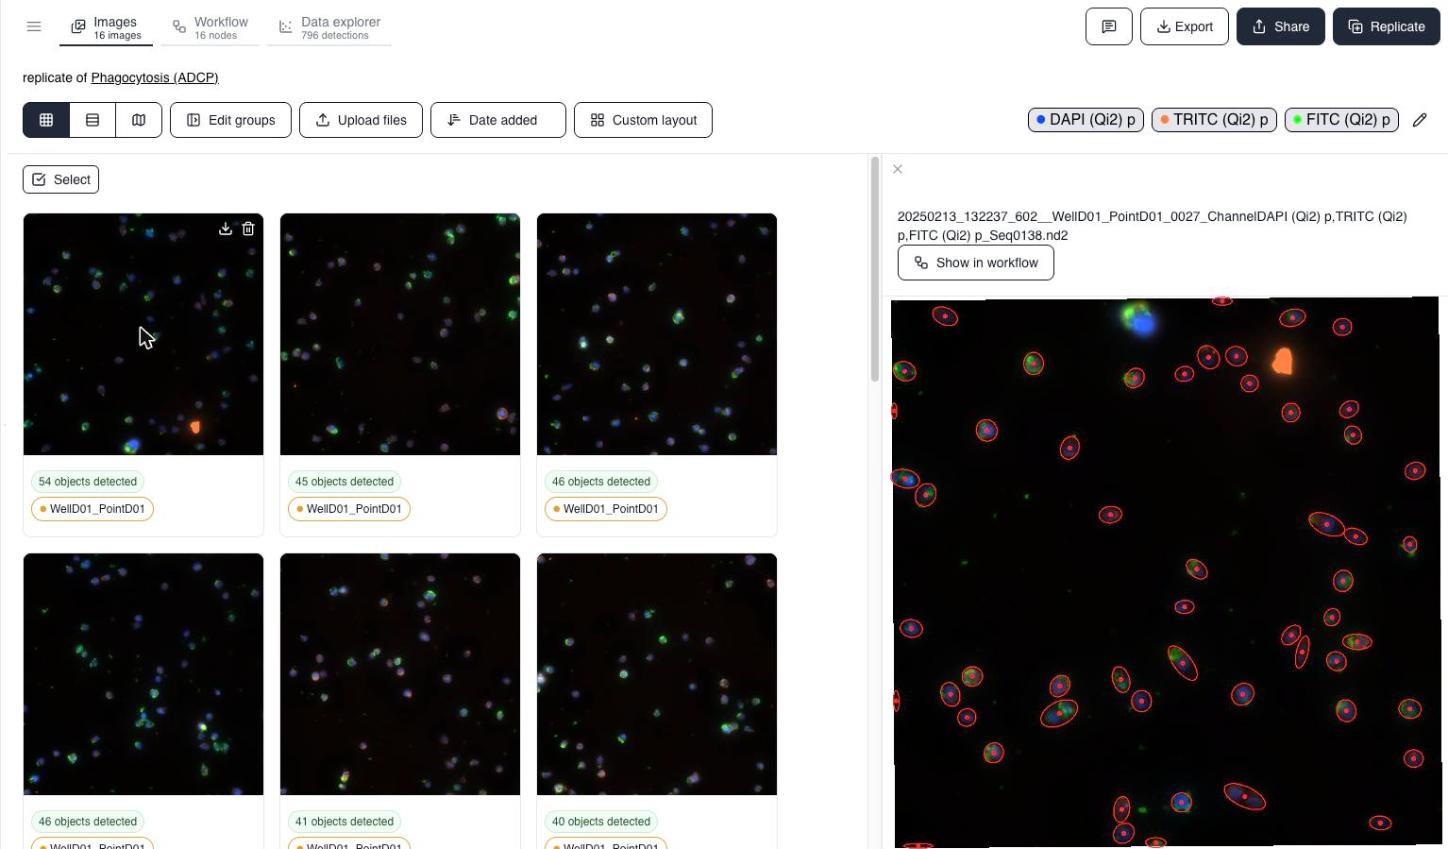
Click any thumbnail to open a side panel with the full-resolution image, an outline overlay marking every detected object, and a Show in workflow link that jumps straight to the Workflow tab with that file preloaded as the node preview source - useful for auditing or debugging a specific field of view.
Starting an analysis
Once at least one image is uploaded, click Configure dataset and then Start analysis in the lower right. Cytely summarizes the dataset and asks how you want to proceed - see Workflow builder for the two paths available.